DataScience Blog
Python- Part 3
July 30, 2020
Continuing with more commands on excel operations.
Getting n number of rows and columns
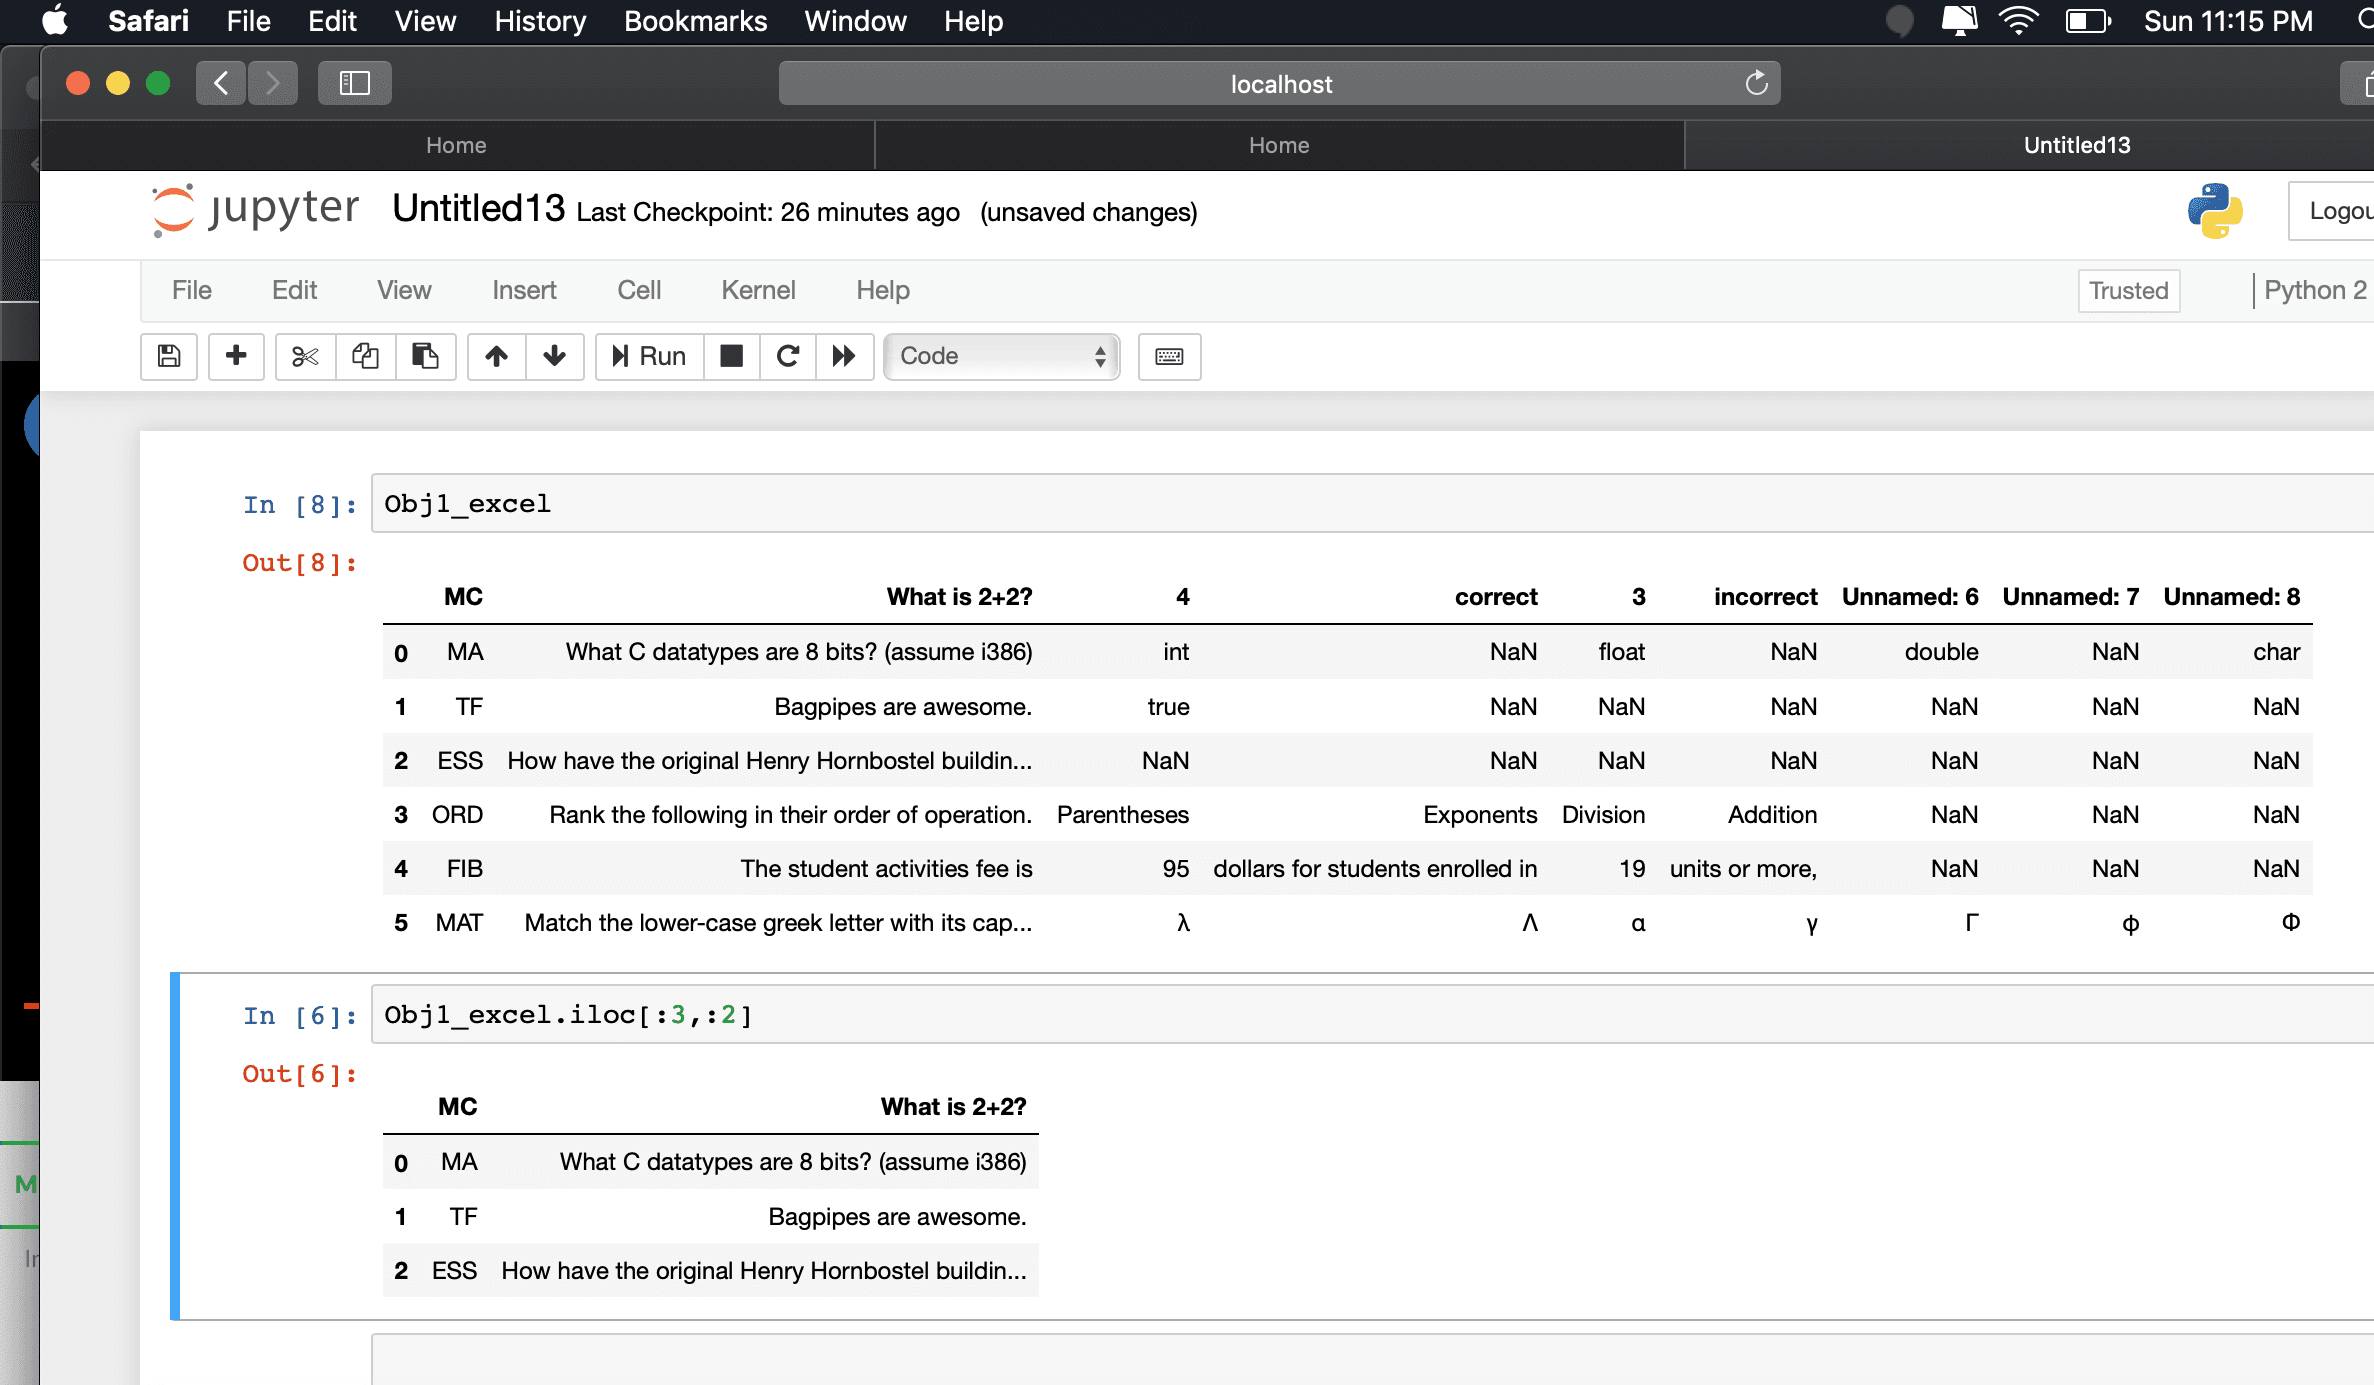
Suppose if we want to extract 3 rows with 2 columns in the excel, then below is the command.
Objname.iloc[:3,:2] - Objname is the name where we stored our excel sheet.
Screenshot for above command
In the screenshot first will be the original excel data and the second will be with 3 rows and 2 columns.
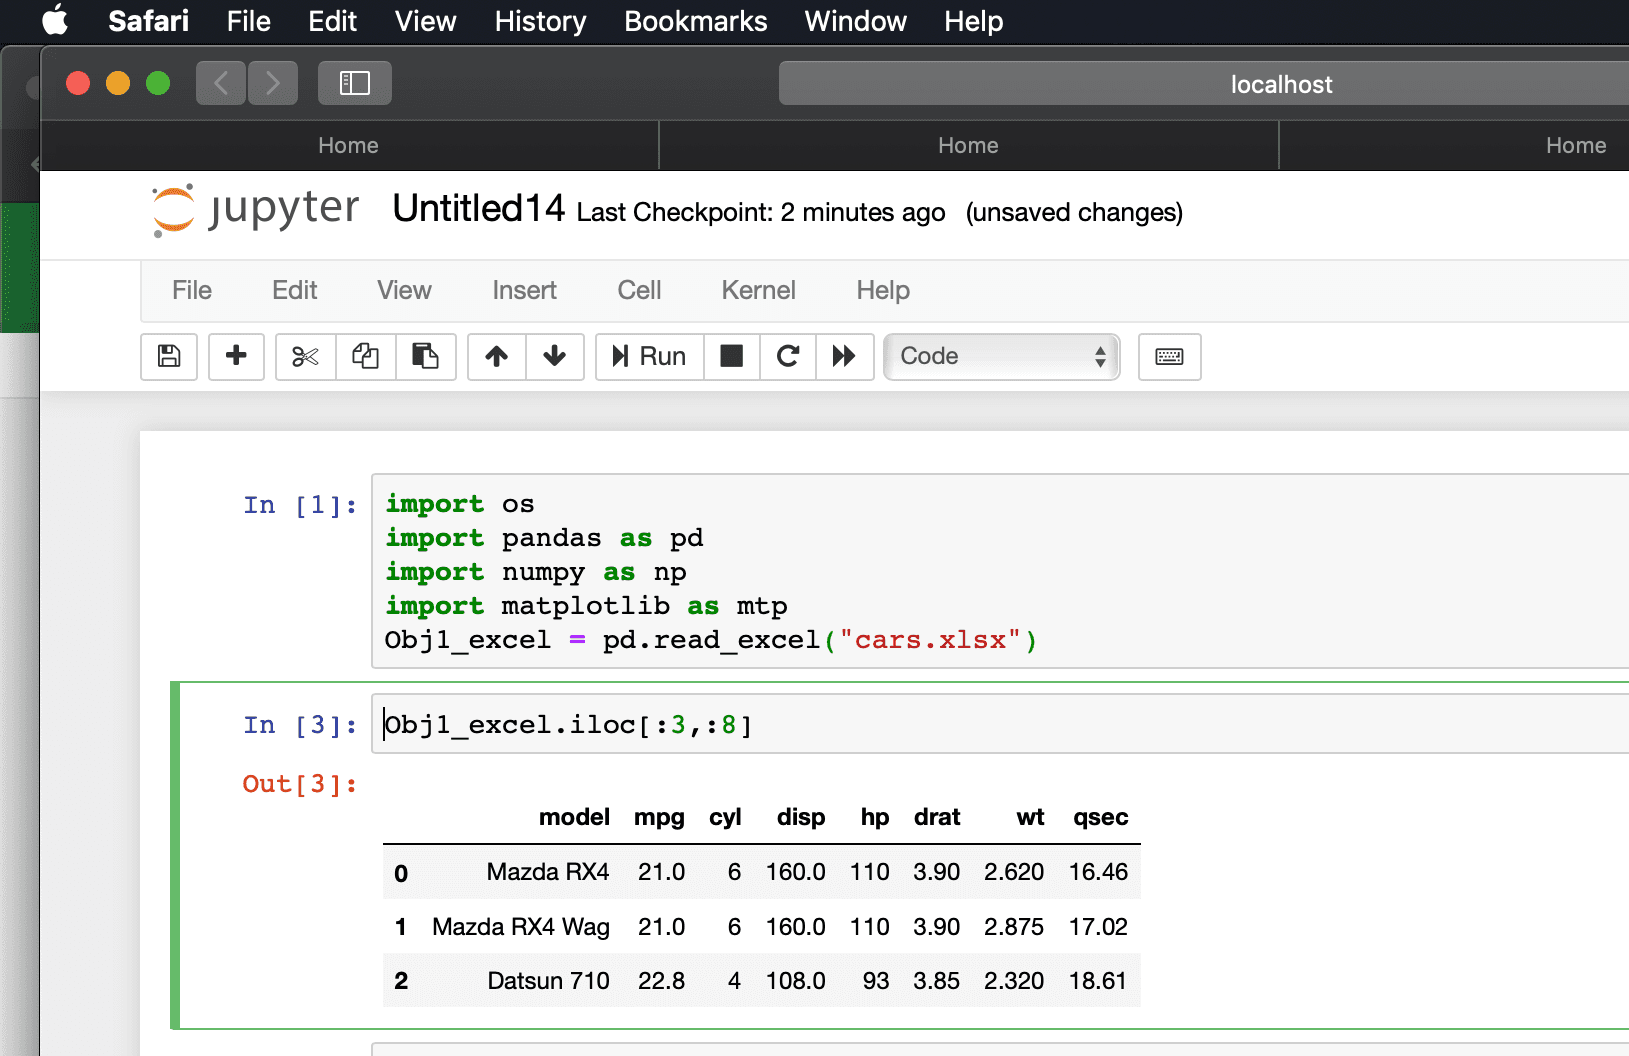
 I have loaded mtcars dataset(We used in R-if you remember). Since it has more numerical values, it would be helpful for us to run statistical calculations. After loading the cars.xlsx to an object, I just ran a command to check out rows and columns. Check the below. It shows 3 rows and 8 columns
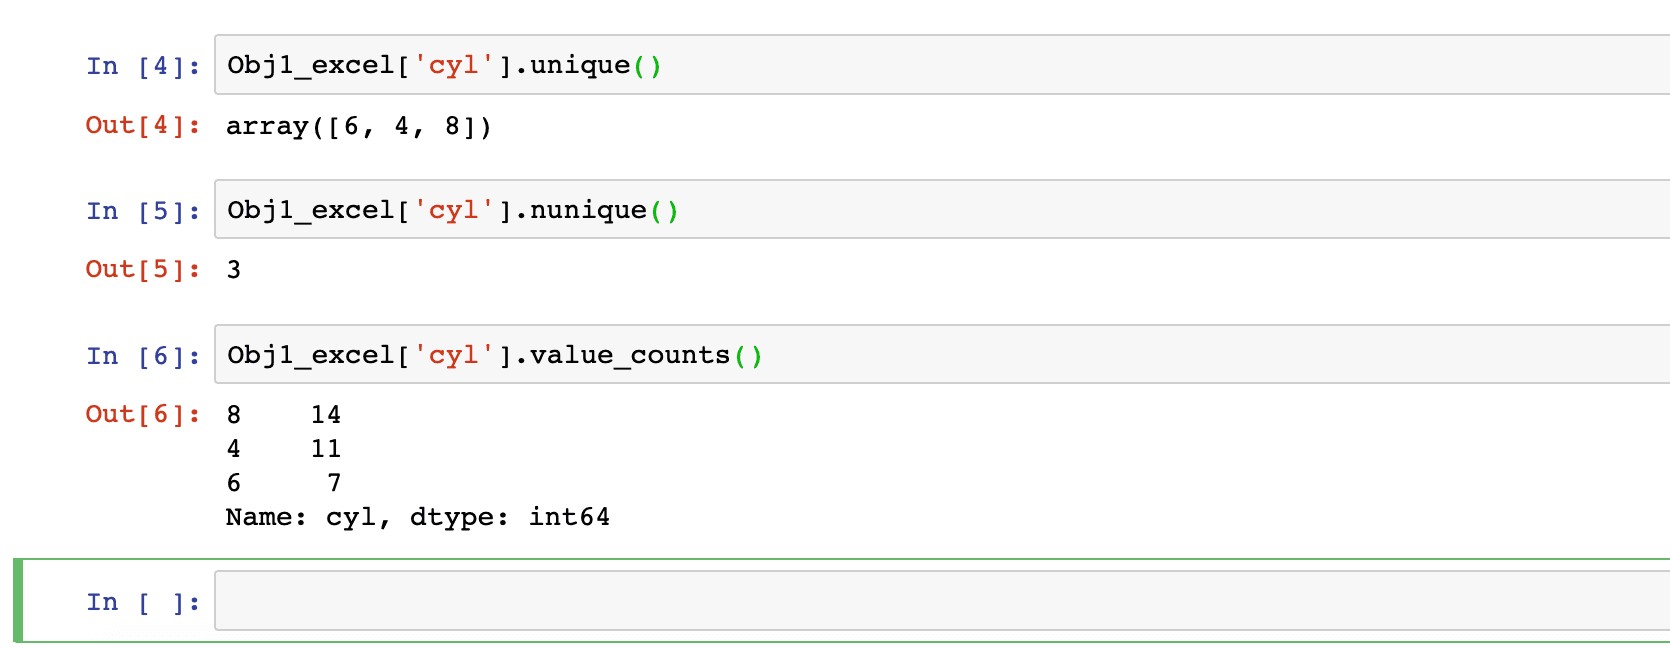
Unique values in a column and its count,distribution
Obj1excel[‘cyl’].unique() -Shows unique values
Obj1excel[‘cyl’].nunique()-Shows number of unique values
Obj1excel[‘cyl’].valuecounts()-Shows distribution and unique values in a particular column
Screenshot for above commands
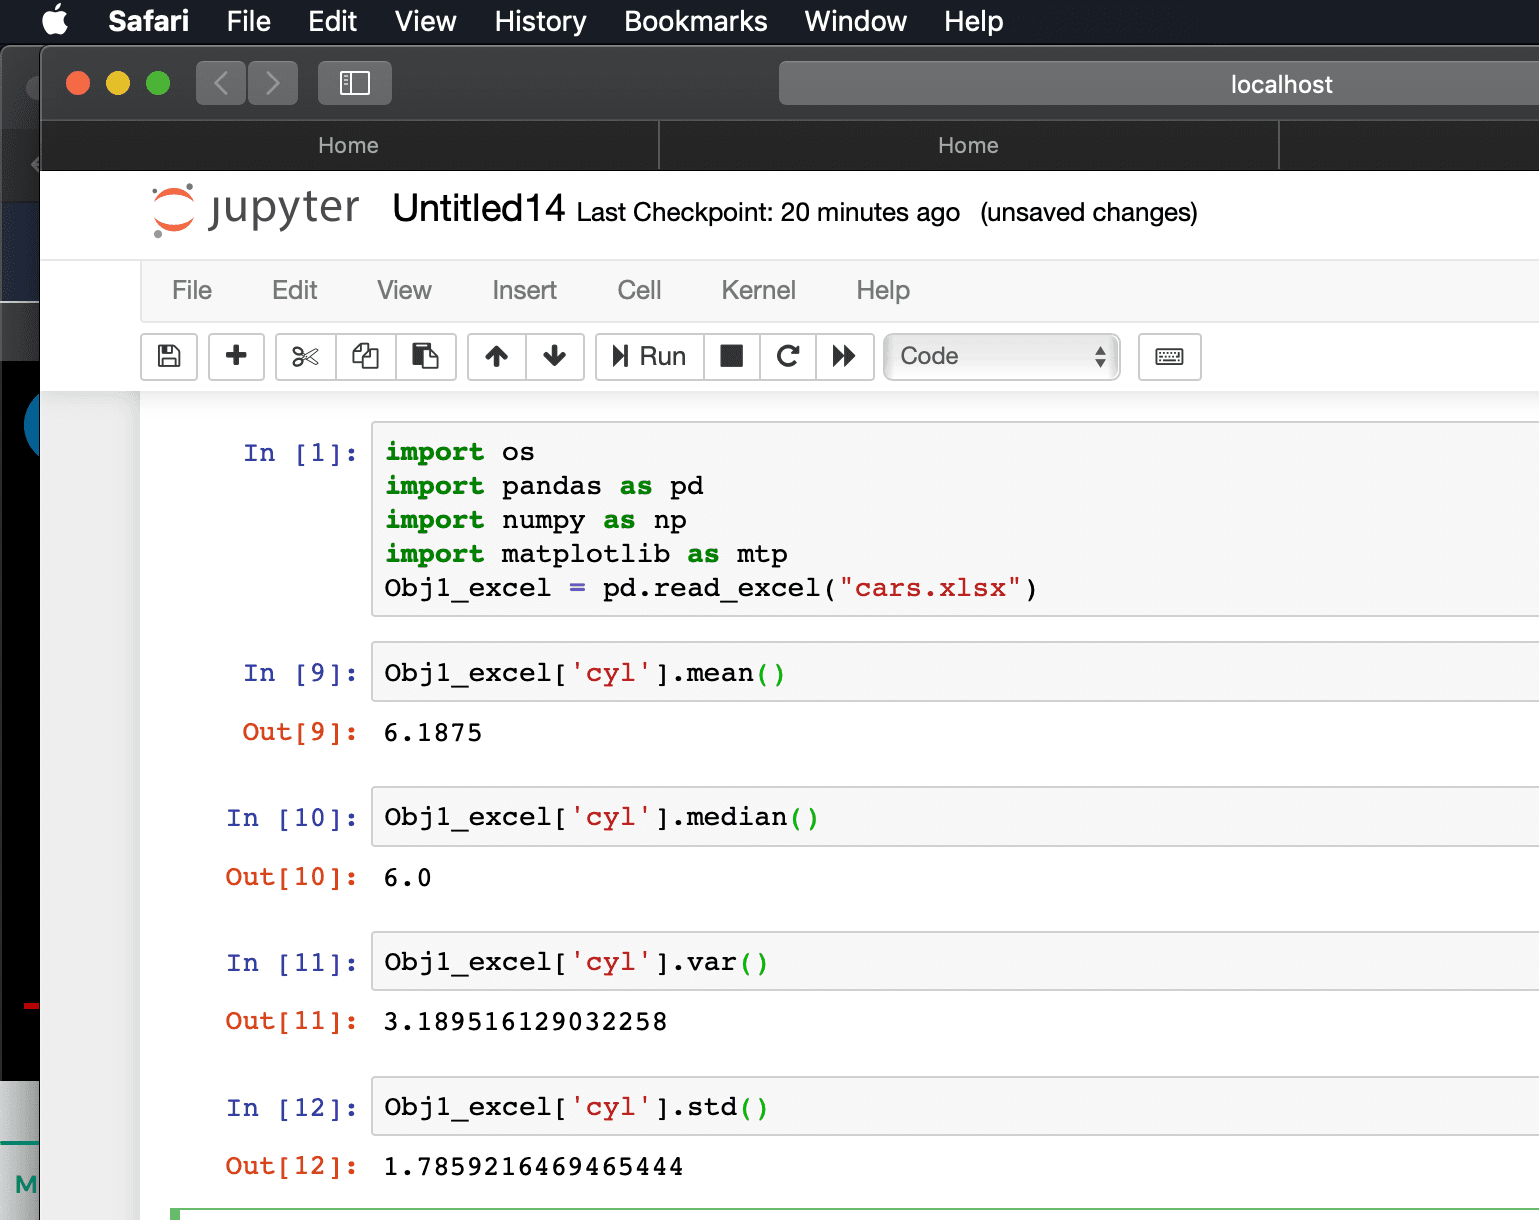
Calculate mean,median, Standard Deviation, Variance
Obj1excel[‘cyl’].mean() // Mean calculation
Obj1excel[‘cyl’].median() // Median Calculation
Obj1excel[‘cyl’].var() // Variance Calculation
Obj1excel[‘cyl’].std() // Standard Deviation Calculation
Screenshot for above command
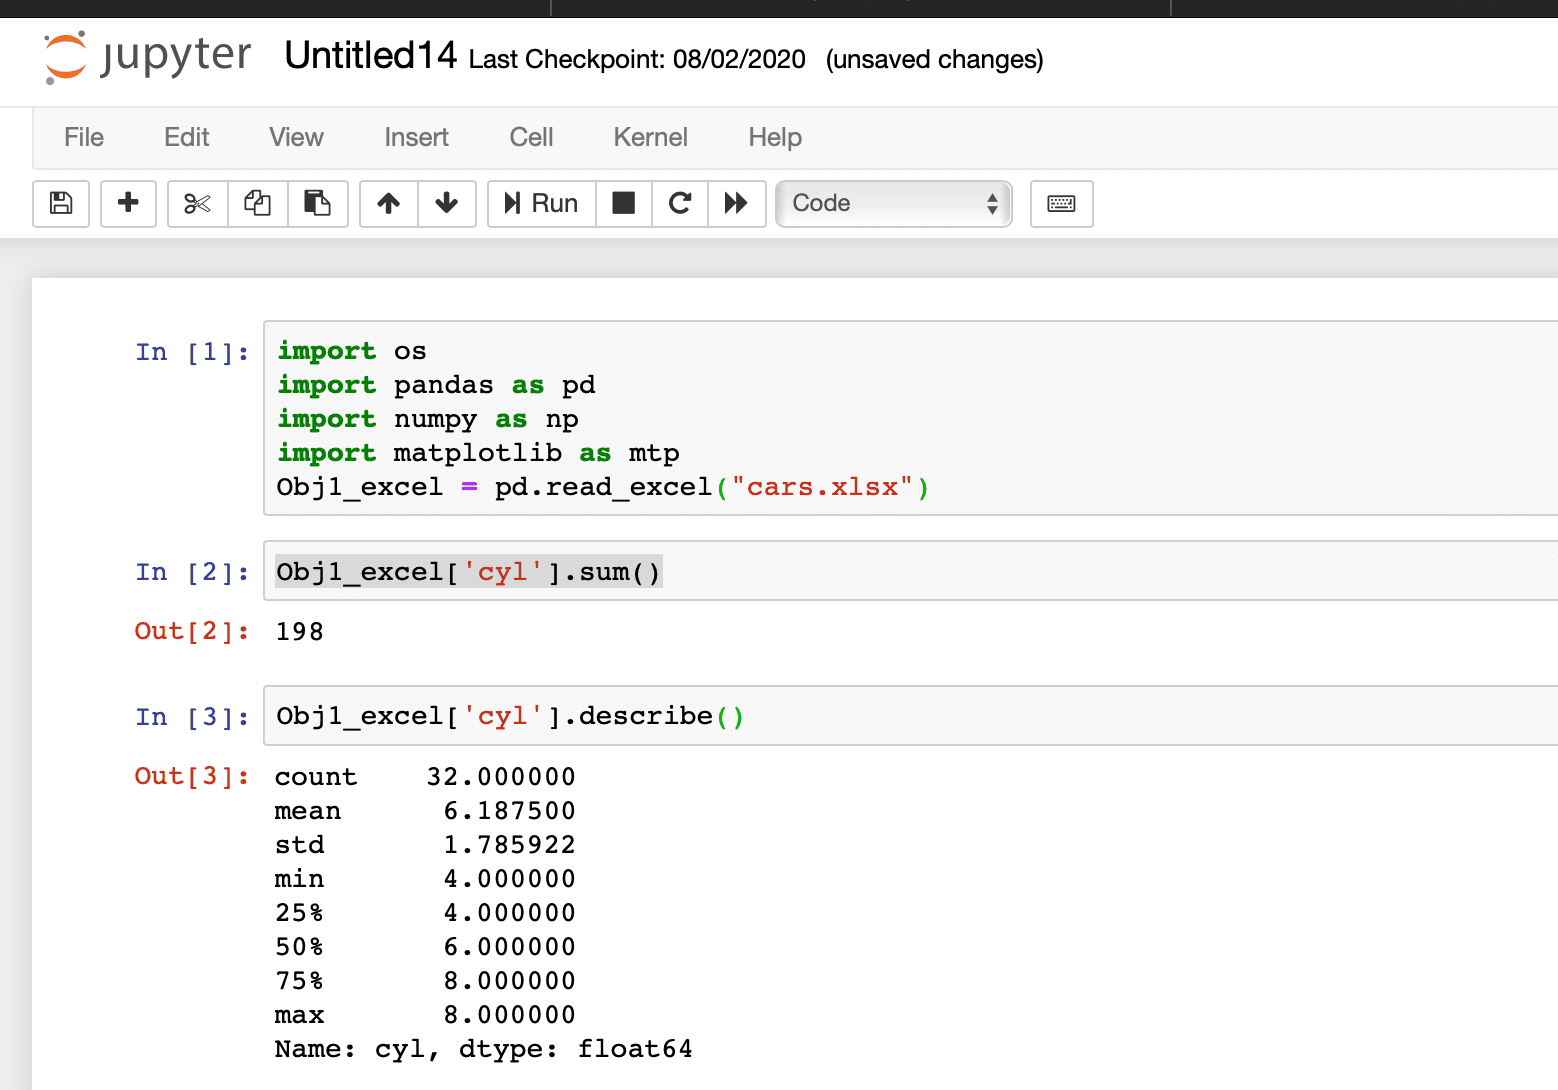
Sum function and describe function
Obj1excel[‘cyl’].sum() // Adding values in column sum
Obj1excel[‘cyl’].describe() // Provide mean, std and other details.. check out the below screenshot.
With this we are ending up here. More python commands are still in line. Stay tuned!!!